Build Analysis
#
Analyzing build statistics is a good step towards understanding webpack better. The available tooling helps to answer the following questions:
- What’s the composition of the project bundles?
- What kind of dependencies do project modules have?
- How does the size of the project change over time?
- Which project modules can be safely dropped?
- Which project modules are duplicates?
- Why is a specific module included to the project bundles?
Configuring webpack
#
To make webpack emit analysis information, you should set the --json flag and pipe the output to a file as follows:
package.json
{
  "scripts": {
    "build:stats": "wp --mode production --json > stats.json"
  }
}
The above is the basic setup you need, regardless of your webpack configuration. Execute npm run build:stats now. After a while you should find stats.json at your project root. This file can be pushed through a variety of tools to understand better what’s going on.
profile to true in webpack configuration.
Node API
#
Stats can be captured through Node. Since stats can contain errors, so it’s a good idea to handle that case separately:
const webpack = require("webpack");
const config = require("./webpack.config.js")("production");

webpack(config, (err, stats) => {
  if (err) {
    return console.error(err);
  }

  if (stats.hasErrors()) {
    return console.error(stats.toString("errors-only"));
  }

  console.log(stats);
});
To detect how webpack configuration is imported, use if (require.main === module) kind of check to detect usage through Node. The idea is then to export the configuration (module.exports = getConfig;) for if and do module.exports = getConfig(mode); for the else clause.
The technique can be valuable if you want to do further processing on stats although often the other solutions are enough.
stats, use stats.toJson(). To get verbose output, use stats.toJson("verbose"). It follows all stat options webpack supports.
--json flag, use console.log(JSON.stringify(stats.toJson(), null, 2));. The output is formatted to be readable.
webpack-stats-plugin and webpack-bundle-tracker
#
If you want to manage stats through a plugin, check out webpack-stats-plugin↗. It gives you control over the output and lets you transform it before writing. You can use it to exclude specific dependencies from the output.
webpack-bundle-tracker↗ can capture data while webpack is compiling. It uses JSON for this purpose.
Enabling a performance budget
#
Webpack allows you to define a performance budget. The idea is that it gives your build size constraint, which it has to follow. The feature is disabled by default, and the calculation includes extracted chunks to entry calculation.
To integrate the feature into the project, adjust the configuration as below:
webpack.config.js
const productionConfig = merge([
  ...
  {
    performance: {
      hints: "warning", // "error" or false are valid too
      maxEntrypointSize: 50000, // in bytes, default 250k
      maxAssetSize: 100000, // in bytes
    },
  },
]);
In case your project exceeds the limits, you should see a warning similar to below:
WARNING in entrypoint size limit: The following entrypoint(s) combined asset size exceeds the recommended limit (48.8 KiB). This can impact web performance.
Entrypoints:
  main (131 KiB)
      runtime.41f8.js
      vendor.1622.js
      main.aca1.css
      main.eddd.js
If you want to enforce a strict limit in a CI environment, set hints to error. Doing this will fail the build in case it is reached and force the developers either go below the limit or raise a discussion about good limits.
Dependency analysis
#
It’s possible to analyze bundle dependencies in a graphical manner, and many tools exist for this purpose:
- The official analyse tool↗ gives you recommendations and a good idea of your application’s dependency graph. It can be run locally as well.
- Statoscope↗ is comparable to the official analyse tool except for the lack of a graph view and it comes with additional filters to understand the output better.
- circular-dependency-plugin↗ lets you detect cycles in the module graph. Often this implies a bug, and it can be a good idea to refactor cycles out.
- dependency-cruiser↗ is a bundler independent tool for analyzing project dependencies.
- madge↗ is another independent tool that can output a graph based on module input. The graph output allows you to understand the dependencies of your project in greater detail.
- Arkit↗ goes a step beyond madge and it constructs entire architectural overviews of projects.
Composition analysis
#
Pie charts, treemaps, and command-line tools let you visualize bundle composition. Studying the generated graphics can generate insights and understand what’s contributing to the bundle size.
Pie charts
#
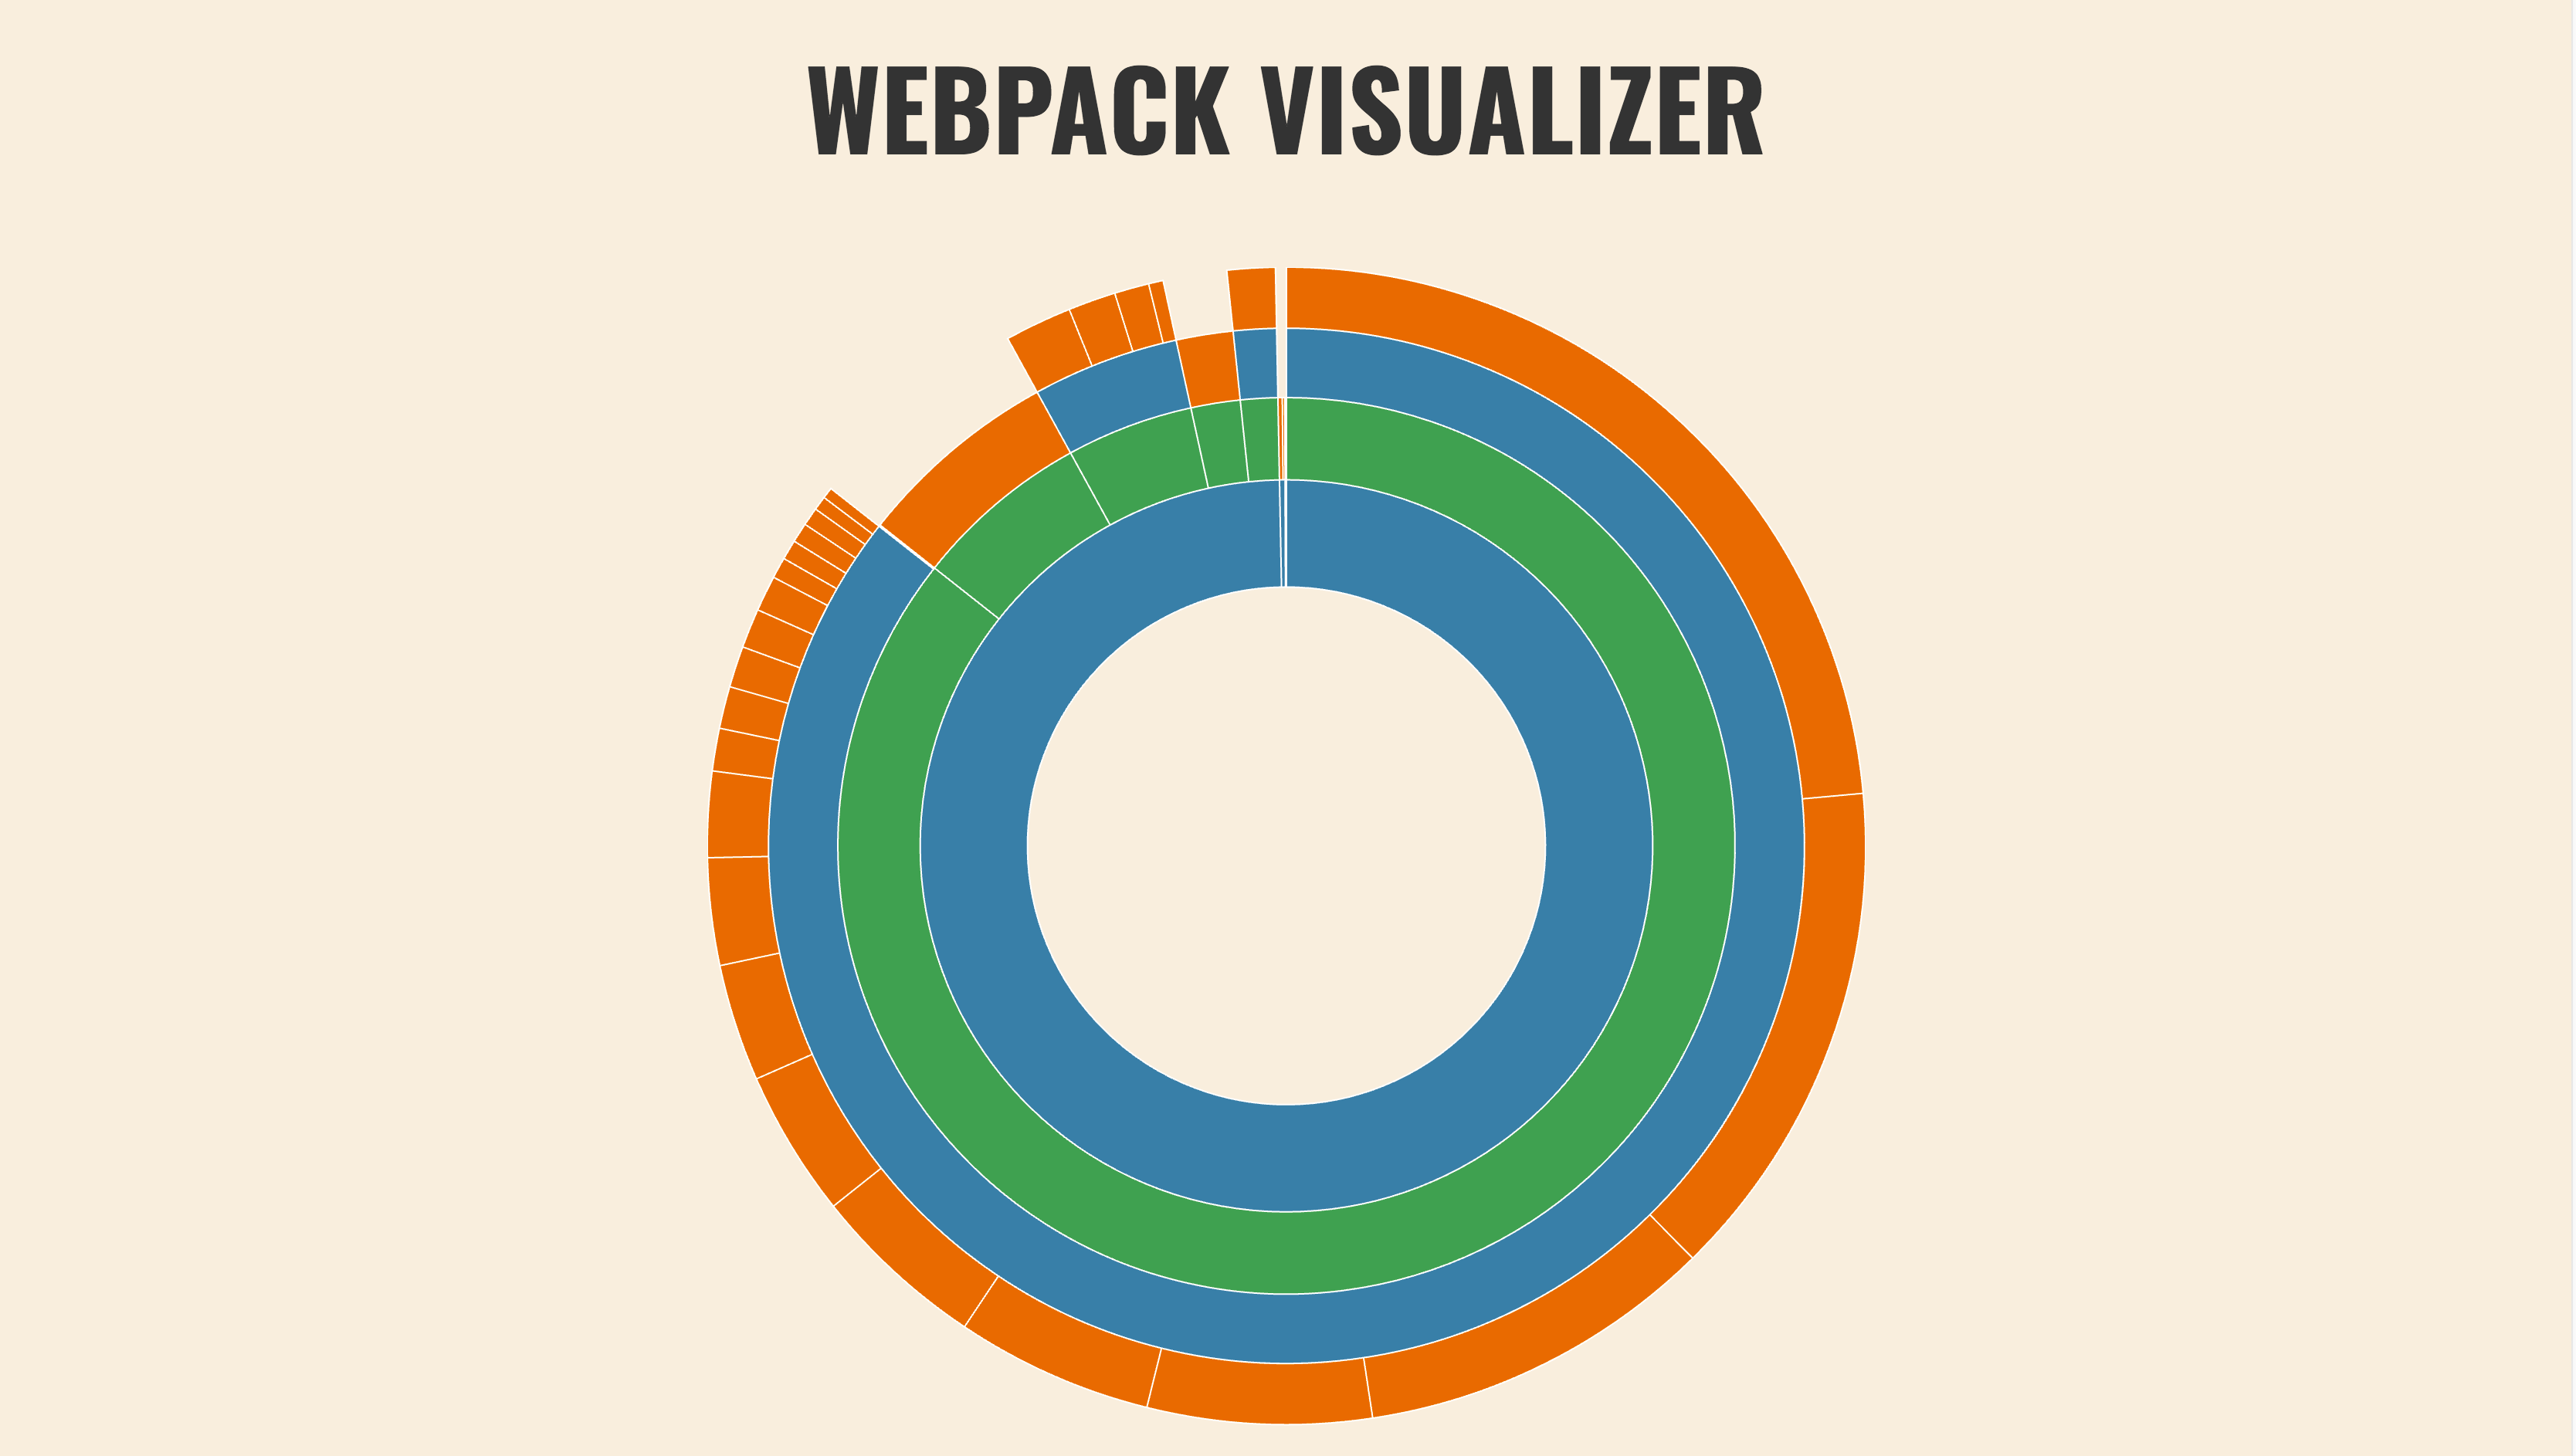
Webpack Visualizer↗ provides a pie chart showing your bundle composition, allowing to understand which dependencies contribute to the size of the overall result. Webpack Chart↗ is another similar option.
In addition to providing a pie chart visualization, Auxpack↗ is able to track bundle size over time.
Treemaps
#
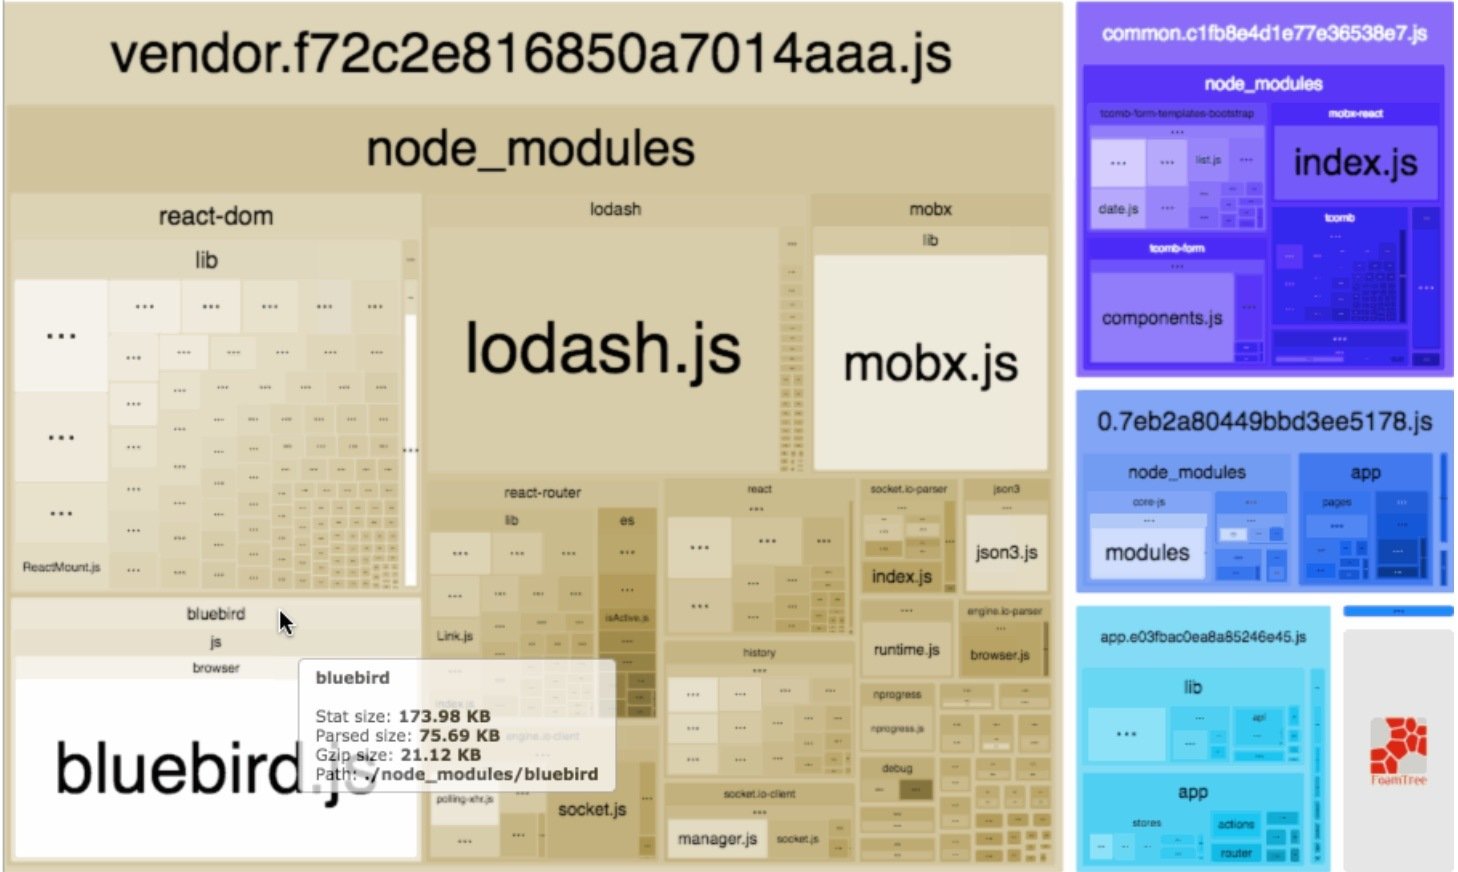
webpack-bundle-analyzer↗ provides a zoomable treemap.
source-map-explorer↗ is a tool independent of webpack. It allows you to get insight into your build by using source maps. It gives a treemap based visualization showing what code contributes to the result. bundle-wizard↗ is another similar tool.
webpack-bundle-size-analyzer
#
webpack-bundle-size-analyzer↗ emits a text based composition:
$ webpack-bundle-size-analyzer stats.json
react: 93.99 KB (74.9%)
purecss: 15.56 KB (12.4%)
style-loader: 6.99 KB (5.57%)
fbjs: 5.02 KB (4.00%)
object-assign: 1.95 KB (1.55%)
css-loader: 1.47 KB (1.17%)
<self>: 572 B (0.445%)
Output plugins
#
There are multiple plugins to make the webpack output easier to understand and more convenient:
- webpackbar↗ has been made especially for tracking build progress.
webpack.ProgressPluginis included out of the box and can be used as well.- webpack-dashboard↗ gives an entire terminal-based dashboard over the standard webpack output. If you prefer clear visual output, this one comes in handy.
Online services
#
It’s possible to integrate bundle analysis to your build process by using Bundle Analyzer↗ (free) and Packtracker↗ (commercial). The services integrate well with GitHub and will show up in your pull requests, as it’s valuable to have the information visible there.
Bundle comparison
#
There are multiple packages which let you compare webpack bundles over time:
- bundle-stats-webpack-plugin↗ lets you generate graphical bundle reports and compare them across builds.
- webpack-bundle-diff↗ operates on a lower level and emits a JSON file with the difference. It could work well with a custom visualization.
- size-plugin↗ prints out the size difference since the last build, and it can be useful during local development.
- webpack-bundle-delta↗ computes a delta between the base branch and the head in pull requests giving you a better idea of the impact of a change size-wise.
Unused files analysis
#
unused-webpack-plugin↗ is able to discover files that aren’t used by the webpack build but are included to the project. remnants↗ is a solution that goes beyond webpack and can be used with other tools as well.
Duplication analysis
#
There are multiple tools for finding duplicates in a project:
- inspectpack↗ has both a command line tool and a webpack plugin for finding duplicate packages.
- find-duplicate-dependencies↗ achieves the same on an npm package level.
- depcheck↗ goes further and warns if there are redundant dependencies or dependencies missing from the project.
Understanding why a module was bundled
#
whybundled↗ has been designed to answer the question why a specific module was included to the bundles. statoscope↗ is a visual interface for the same purpose.
stats.reasons to true through webpack configuration to capture similar information.
Conclusion
#
When you are optimizing the size of your bundle output, these tools are invaluable. The official tool has the most functionality, but even basic visualization can reveal problem spots. You can use the same technique with old projects to understand their composition.
To recap:
- Webpack allows you to extract a JSON file containing information about the build. The data can include build composition and timing.
- The generated data can be analyzed using various tools that give insight into aspects such as the bundle composition.
- Performance budget allows you to set limits to the build size. Maintaining a budget can keep developers more conscious of the size of the generated bundles.
- Understanding the bundles is the key to optimizing the overall size, what to load and when. It can also reveal more significant issues, such as redundant data.
You’ll learn to tune webpack performance in the next chapter.